

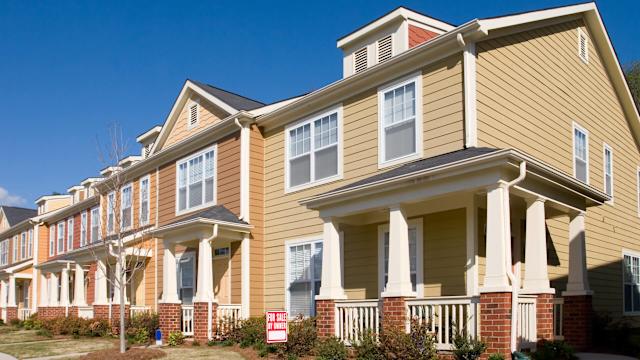
Want To Buy a House in These 5 Cities? Hurry Up — They Are Becoming Increasingly Unaffordable
Although the estimated amount might be lower for 2025, the last reported median household income in the United States was $80,610 in 2023, according to the U.S. Census Bureau. Using the common 3X annual income rule to calculate how much you should spend on a house, the average American homebuyer making the median annual salary should have a target price of $241,830.
High Yield Savings Offers
Earn 4.10% APY** on balances of $5,000 or more
View Offer
Earn up to 4.00% APY with Savings Pods
View Offer
Earn up to 3.80% APY¹ & up to $300 Cash Bonus with Direct Deposit
View Offer Powered by Money.com - Yahoo may earn commission from the links above.Unfortunately, the median existing-home sales price increased 1.8% to $414,000 in April 2024, marking an all-time high for the month and the 22nd consecutive month of year-over-year price gains, according to a National Association of Realtors (NAR) press release from May.
Although some housing measures have improved over the past 12 months — such as inventory increasing significantly — the U.S. still has a major housing affordability crisis. High prices and interest rates mixed with a still-limited supply has made the “American Dream” of owning a home out of reach to the vast majority of the country’s citizens.
Read More: 25 Places To Buy a Home If You Want It To Gain Value
Check Out: I'm a Retired Boomer: 6 Bills I Canceled This Year That Were a Waste of Money
Although things are tough all over, a recent Lending Tree study found that certain parts of the country have worse housing crisis outlooks than others. Looking at vacancy rates, housing unit approvals, home value-to-income ratios and changes in those ratios, the study found that metros with the worst housing forecasts are primarily located in the Pacific Northwest (PNW) and those with the best outlooks are based in the South.
While the overall outlook is less positive in the PNW, the metros with the biggest increases in home value-to-income ratios (used to measure unaffordability) might surprise you. Here are the five cities LendingTree found to have the greatest increases in unaffordability, per changes to home value-to-income ratio between 2022 and 2023.
5. Atlanta
-
Change in home value-to-income ratio 2022 to 2023: 6.97%
-
Overall housing outlook rank: 24
Around the same time LendingTree ended its study, Redfin reported that only 15.5% of homes for sale that year were affordable for the typical American household. Redfin found Atlanta experienced a -48.9% change in the number of affordable listings between 2022 and 2023, matching LendingTree’s recorded high change to home value-to-income ratio of 6.97% during the same timeframe.
Significantly, Atlanta’s vacancy rate and housing unit approvals per 1,000 were on the low side, which influenced house prices to rise in the area, per Lending Tree.
Consider This: The Cheapest Place To Buy a Home in Every State
4. Boise, Idaho
-
Change in home value-to-income ratio 2022 to 2023: 7.12%
-
Overall housing outlook rank: 2
Boise, Idaho, has the second-lowest vacancy rate (4.56%) and ranked second overall in LendingTree’s housing outlook study. It also saw the fourth-largest gain in its home value-to-income ratio, climbing 7.12% between 2022 and 2023.
3. Spokane, Washington
-
Change in home value-to-income ratio 2022 to 2023: 7.17%
-
Overall housing outlook rank: 4
LendingTree’s study found that three of the five metros in the Pacific Northwest, including Portland and Boise, Idaho, had the worst housing outlooks. Spokane, Washington, ranked fourth overall, in the bottom third in vacancy rate (6.33%) and third in change in home value-to income ratio (7.17%). While the median listing home price in Spokane trended down marginally from April to May 2025 year-over-year, it still sits at around $465,000, per Realtor.com.
2. Charlotte, North Carolina
-
Change in home value-to-income ratio 2022 to 2023: 7.2%
-
Overall housing outlook rank: 30
According to Zillow, the average home value in Charlotte is $404,294, increasing more than 53% from May 2020. North Carolina’s most populous city had an overall LendingTree housing outlook rank of 30, but has seen the gap between home values and household income widen considerably since 2022. However, Charlotte didn’t have the highest ratio change in the Tarheel State.
1. Durham, North Carolina
-
Change in home value-to-income ratio 2022 to 2023: 8.6%
-
Overall housing outlook rank: 19
California metros occupied seven of the top 10 highest home value-to income ratios in LendingTree’s housing outlook study. That’s not surprising — California (and Hawaii) consistently ranks high among U.S. states when comparing median incomes with median home prices.
However, Durham, North Carolina, holds the distinction among cities studied by LendingTree of having the greatest change in home value-to-income ratio. Durham’s median household income is $81,017, with a median home value of $359,400 (a 4.4 ratio), but its ratio change between 2022 and 2023 was a whopping 8.6%.
More From GOBankingRates
-
6 Costco Products That Have the Most Customer Complaints
-
Mark Cuban Warns of 'Red Rural Recession' -- 4 States That Could Get Hit Hard
-
Are You Rich or Middle Class? 8 Ways To Tell That Go Beyond Your Paycheck
-
4 Affordable Car Brands You Won't Regret Buying in 2025
This article originally appeared on GOBankingRates.com: Want To Buy a House in These 5 Cities? Hurry Up — They Are Becoming Increasingly Unaffordable
![Isothermal Bags Containers Market [2028]: Top Trends, Size, and Competitive Intelligence - TechSci Research](https://antiochtenn.com/zb_users/upload/2025/07/20250719012446175285948669203.jpg)


If you're eyeing up a home in one of these five rapidly gentrifying cities, swift action is advised before escalating real estate prices make the dream beyond reach for many aspirants.

The surge in demand for houses documented by the article underscores how urgent it is, especially those considering making a move to these five cities: don't delay your plans as increasing unaffordability looms larger with every day that passes.

Here's a timely reminder for potential home buyers: due to rapid growth and gentrification, properties in these top 5 cities are becoming increasingly scarce & expensive. Act now before housing affordability becomes out of reach!

As real estate prices continue to skyrocket in these five cities, prospective homebuyers must act swiftly if they want a piece of the ownership dream before it becomes increasingly outreach for most.